Financial Summary

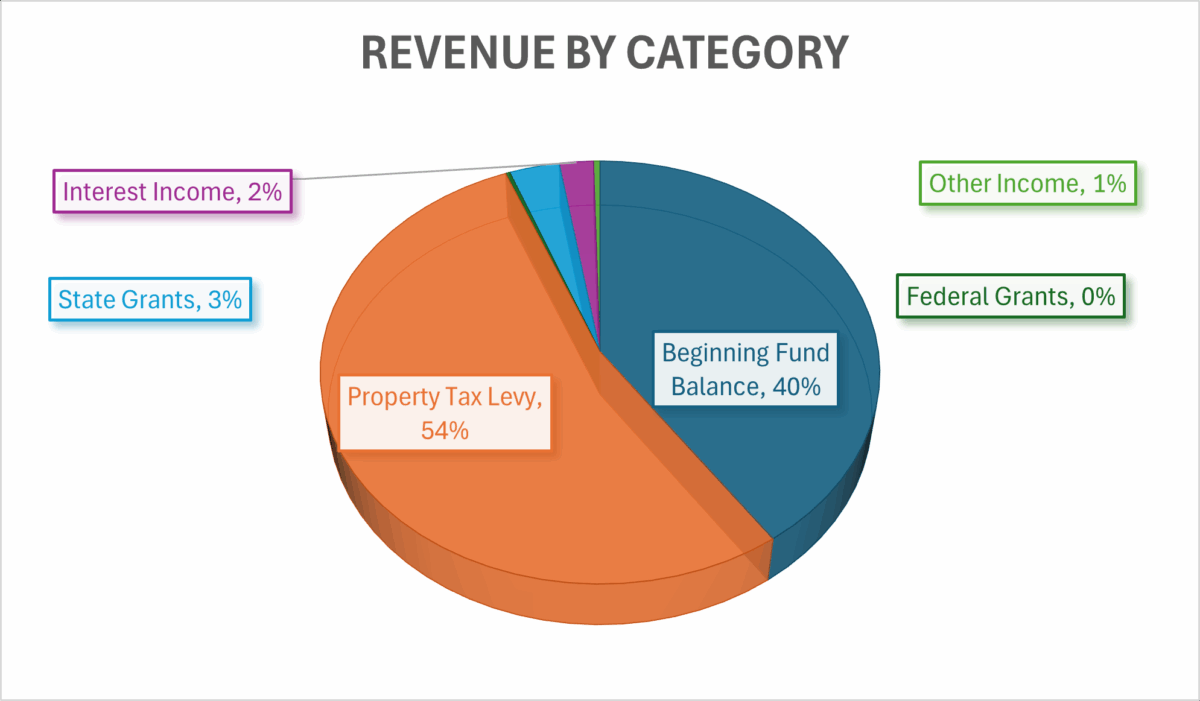
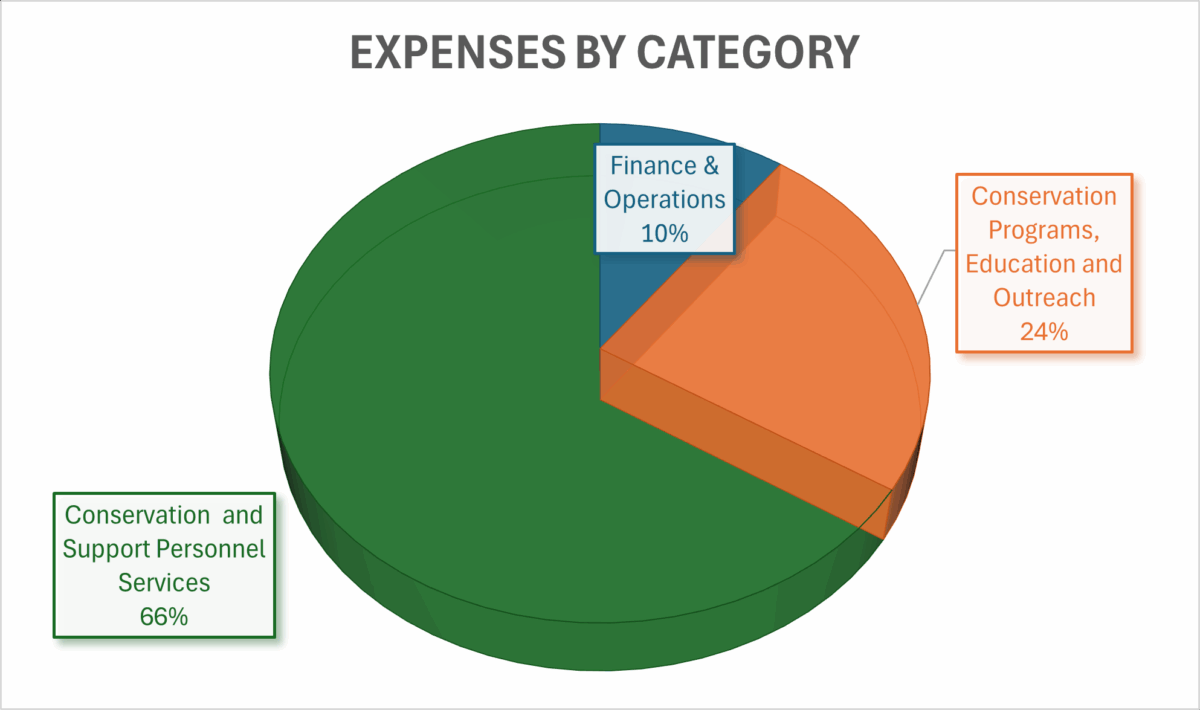
We share these statements, as well as our full budget on our site, to reflect our commitment to transparency and responsible resource management. Every year, we welcome community members to our Budget Committee; please get in touch if you’d like to join.

Revenue and Expenses:

Pie chart for revenue by category. Described below.
Revenue by categoryAmountPercent of Revenue
Property Tax Levy$2,106,82754%
Beginning Fund Balance$1,584,18540%
State Grants$125,0713%
Interest Income$85,0422%
Other Income$16,150~1%
Federal Grants$11,063<1%
Total$3,928,338100%

Expenses by category pie chart with green and orange and blue. See description below.
Expenses by CategoryAmountPercent of Expenses
Conservation and Support Personnel Services$1,549,82266%
Conservation Programs, Education, and Outreach$564,28624%
Finance & Operations$237,73910%
Total$2,351,847100%