Data analysis by Shahbaz Khan, GIS and conservation technician, Mary Logalbo, urban conservationist until May 2024, and article by Eleanor Greene, outreach and communications coordinator
The West Multnomah Soil and Water Conservation District (WMSWCD) is dedicated to understanding the community we serve. Our aim is to ensure that our programs and representation reflect the culturally diverse makeup of our district.
In our Long Range Business Plan, the District set a goal to analyze results of the 2020 US Census data and 2017 Census of Agriculture to better understand the demographics of the district and use that information to inform strategies that focus on producing more equitable outcomes in the delivery of our services.
Another goal of this demographic data analysis is to be able to set objectives regarding staff, board, contracts, and purchasing awards. Using our findings, we can set and measure our performance towards those objectives.
This study builds on a similar analysis conducted in 2017, allowing us to delve deeper into our community’s demographics and identify trends that can help us achieve our racial equity goals. We analyzed demographic and socio-economic data from the U.S. Census, focusing on seven key characteristics: age, race/ethnicity, limited English proficiency (LEP), income (including those below the federal poverty level), employment status, educational attainment, tenure (meaning whether someone is a renter or owner), and household size. Our team started this study in 2023 and completed it in April 2024.
Which Data Did We Analyze?
We utilized both the 2020 U.S. Census and the 2017-2022 5-year estimates from the American Community Survey (ACS). The 2020 census provides accurate counts of the population, including race and ethnicity per individual. The ACS helps us understand the changing social and economic aspects of our population, providing a comprehensive view of our demographics. While our demographic maps and data align with the U.S. Census Bureau’s figures, it’s important to note that these are estimates. When interpreting the data, it’s essential not to focus solely on exact percentages or counts but rather on broader patterns. Small differences may fall within the margin of error, so a wider perspective is crucial.
WMSWCD General Population Characteristics
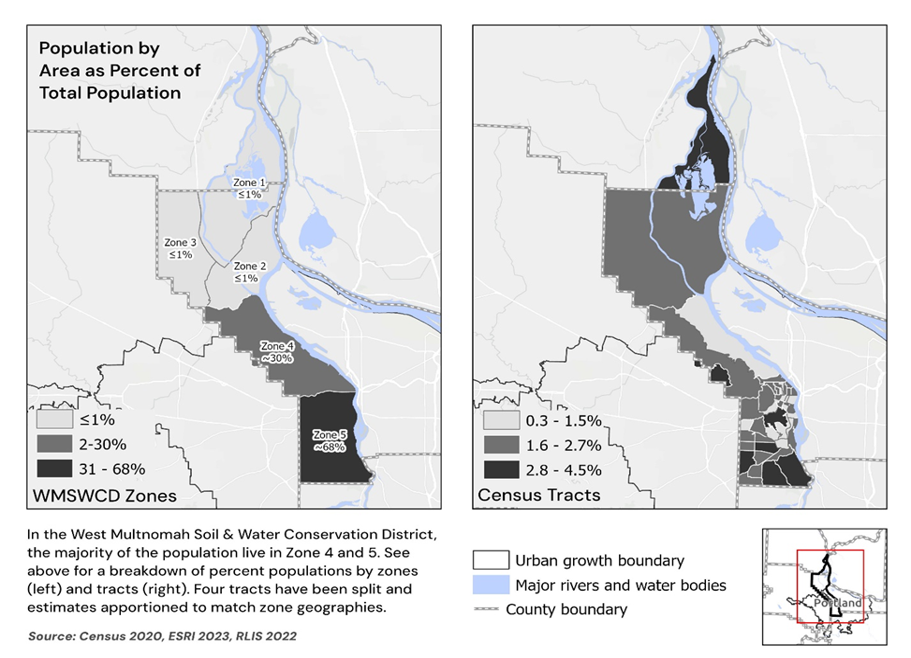
WMSWCD is home to approximately 151,000 residents. Most live in Zones 4 and 5, which account for about 30% and 68% of the population, respectively. In contrast, Zones 1 to 3 are significantly smaller, each comprising less than 1% of the total population, or around 1,000 individuals.

Age
In terms of age distribution, the population is relatively balanced across different age groups. However, the “18-24” and “75 and older” age groups are the smallest, making up only about 8.6% and 6% of the total population, respectively. The largest age group is “25-34,” representing roughly 18% of residents.
Race and Ethnicity
While “race” is a social construct with no biological foundation, race has been historically used to decide the “haves” and the “have-nots” in all parts of American society, and particularly when it comes to access to wealth in the forms of ownership of homes and land. Our 2021-2025 Long Range Business Plan and 2019 study, Whose Land is Our Land? Spatial Exclusion, Racial Segregation, and the History of the Lands of Western Multnomah County delve deeper into this history and our goals of diversity, equity, and inclusion.
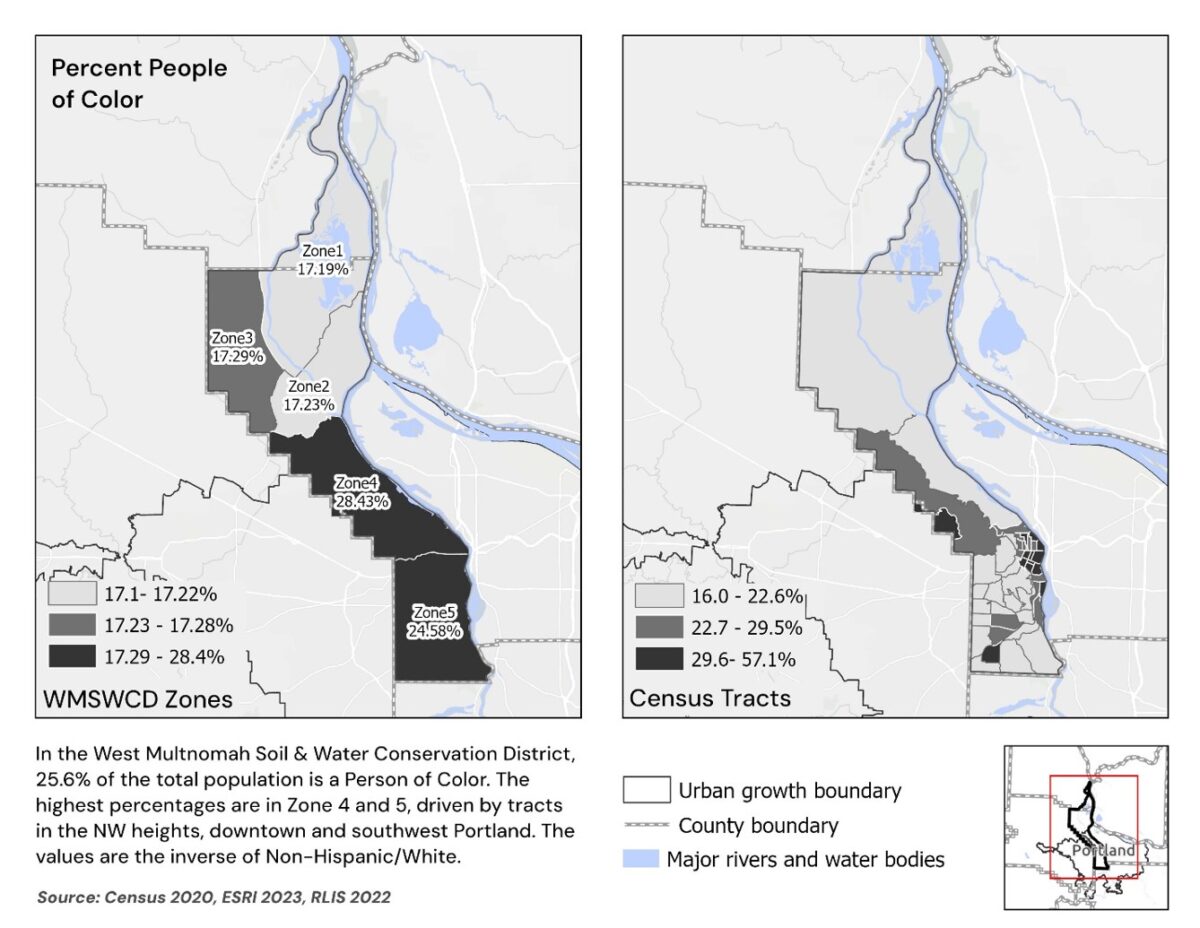
In terms of racial and ethnic demographics, the predominant racial group is White, making up 74.4% of the total population, followed by Two or More Races (7.0%), Asian (6.9%), and Black or African American (2.7%), with American Indian and Alaska Native, Native Hawaiian and other Pacific Islander, and “some other race” making up the remaining 1.6% of the population.
As far as ethnicity, approximately 7% of the district’s population identifies as Hispanic, with the largest Hispanic racial category being Two or More Races (3.2%), followed by White (2.0%) and Some Other Race (1.7%). Most of the Hispanic population is concentrated in Zones 4 and 5, particularly in downtown and southwest Portland, where it exceeds 7.2%. Notably, Zones 1-3 have a similar proportion of Hispanic residents relative to their total population, despite having significantly fewer individuals overall. Overall, 25.6% of the population consists of people of color, both Hispanic and Non-Hispanic.

Languages Spoken
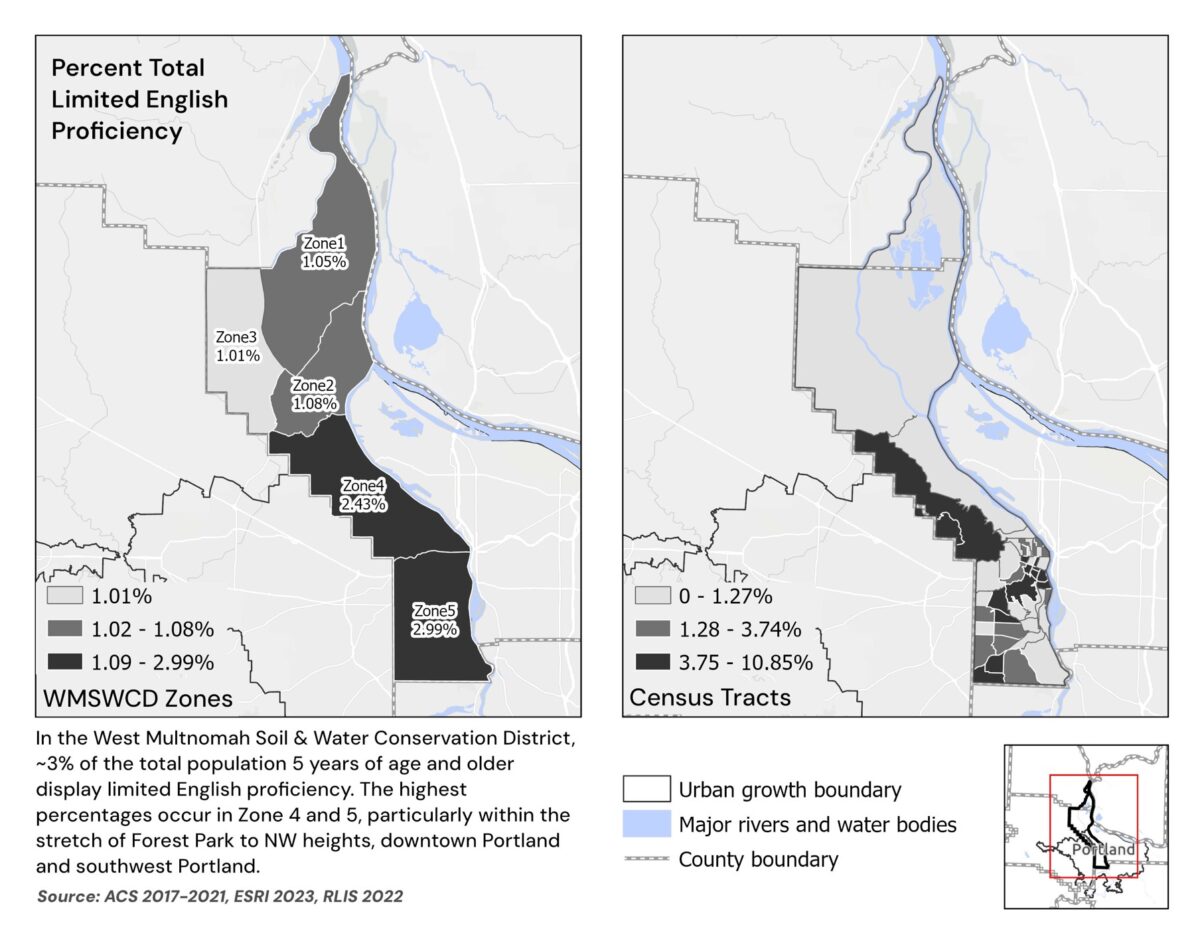
In terms of languages spoken across the District, 85.7% of the population speaks English. Spanish speakers make up 3.3%, while 2.5% speak Chinese (including Mandarin and Cantonese), and 8.6% speak other languages. Approximately 3% of residents have limited English proficiency (LEP), with the largest LEP populations speaking Chinese (0.91%) and Spanish (0.54%). Other groups with notable amounts of LEP include those who speak the languages Korean, Russian/Polish/Slavic, Vietnamese, French Creole, and Arabic in descending order of amounts (as well as Somali and Japanese, which are not included in ACS categories, but prevalent in our District per the 2017 analysis).

Economic Overview: Income, Poverty, Education, and Employment
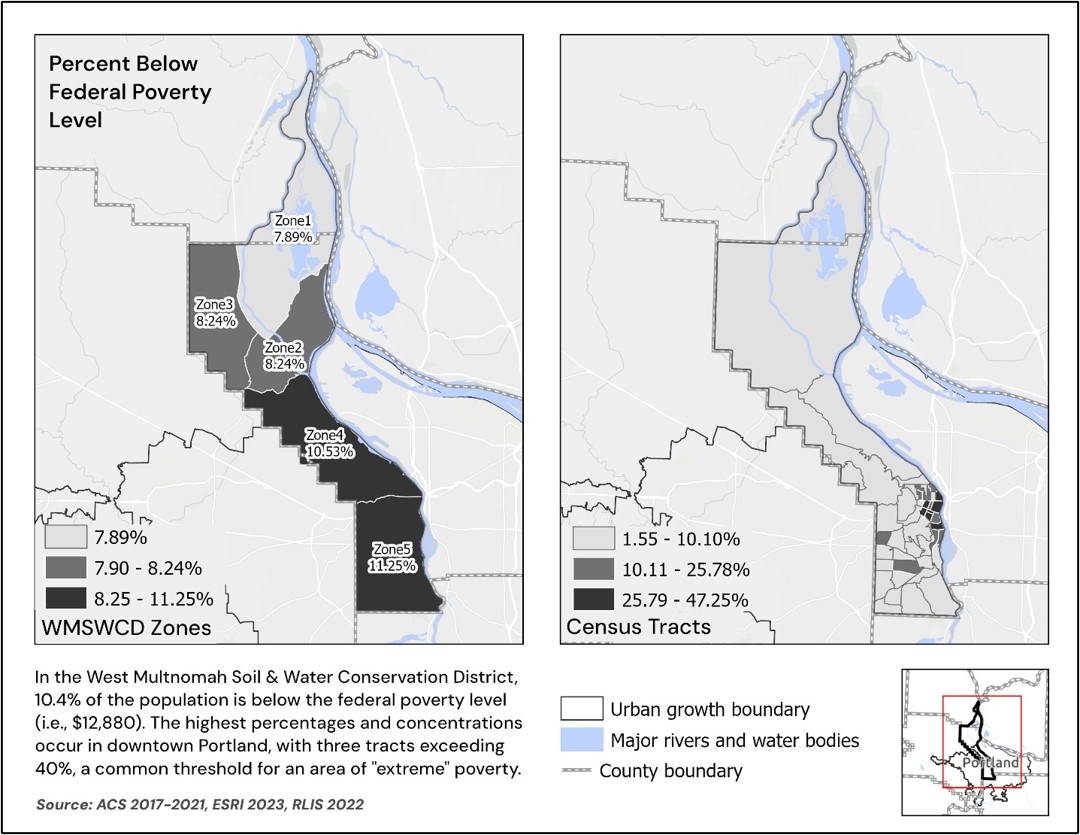
Economically, of the 76,250 households reported on by the Census, households earning more than $50,000 are prevalent, with 69% of households falling into that category. The highest income bracket, $200,000 or more, is represented by about 19% of households of that 69%. However, about 10.4% of the population lives below the federal poverty level of $12,880. The highest concentrations of the lowest income are found in downtown Portland, where three Census tracts exceed 40% poverty, which is a common threshold for naming an area one of “extreme poverty.” Additionally, 19.4% of residents are below 200% of the federal poverty level ($25,760).

The labor force consists of approximately 95,000 individuals, or about 67% of the total population, with an unemployment rate of around 4.24%. The highest unemployment rates are concentrated in downtown Portland, particularly in Zones 4 and 5.
Education levels vary, with about 35% of residents holding a Bachelor’s degree and 18% having a graduate or professional degree. Approximately 20% have attended some college without earning a degree, while about 2.96% have not completed high school, primarily in downtown areas. The district is home to 106 schools for ages 5-18, including 39 public and 67 private institutions (not including post-secondary education such as colleges and universities), mostly located in Zones 4 and 5.
Housing Trends
Housing trends reveal that about 51% of households are renters, especially prevalent in downtown and the Pearl and Alphabet districts. The other category tracked are those who are homeowners. The average household size is 1.94 persons, with larger households typically found in areas with higher homeownership rates, like Zones 1-3.
Next Steps
Our team plans to use this data to make sure we are setting and meeting realistic outreach and service goals for all communities in our district. We will continue to monitor the demographics of the people who make up the District, with plans to replicate the analysis using the 2030 Census.
As stated at the beginning, another goal of this demographic data analysis is to be able to set objectives regarding staff, board, contracts, and purchasing awards. Using our findings, we can set and measure our performance towards those objectives.