Sometimes the easiest way to understand all we do is to look at the numbers. Take a look at these and see all the work we do!

$262,995 to on-the-ground projects
27,213 native plants installed

942 people served at outreach events
873 people served at education events
488 residents and land managers served
16 conservation plans created


104 partners engaged
$195,792 in support of partner projects

3,912 acres surveyed for priority weeds
183 acres of native habitat enhanced
6 acres of cropland improved through soil health practices
District Conservation Projects 2023-2024
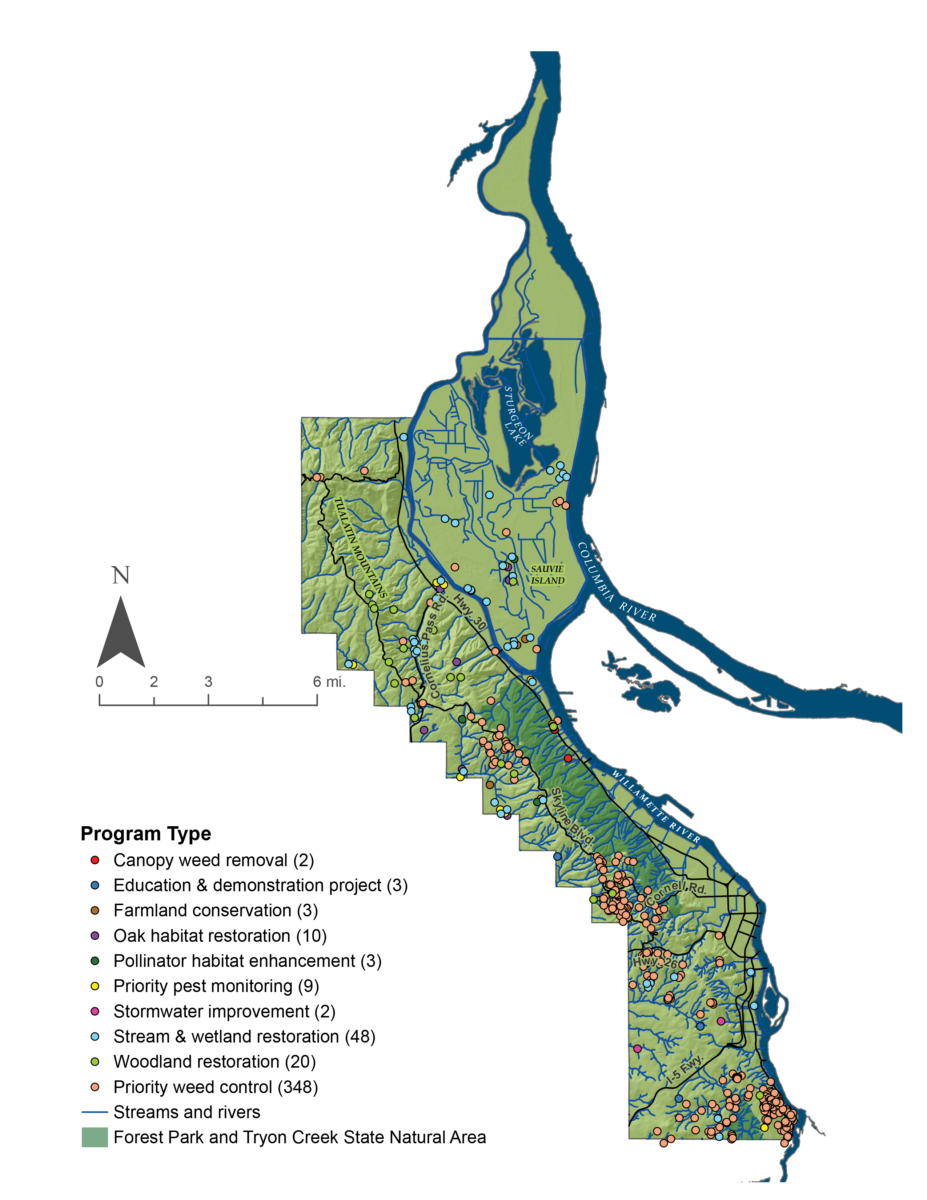
Priority Weed Control: 348 sites
Stream and wetland restoration: 48
Woodland restoration: 20
Oak habitat restoration: 10
Priority pest monitoring: 9
Education and demonstration projects: 3
Farmland conservation: 3
Pollinator habitat enhancement: 3
Canopy weed removal: 2
Stormwater improvement: 2